We are excited to announce the winners of the useOSM Map<>kathon 2026 🎉! Over the past few weeks, mappers, developers, and geospatial enthusiasts from around the world came together to build tools and projects that make OpenStreetMap data more useful for everyone. The Map<>kathon brought in submissions that show just how creative and practical the OSM community can be when given a problem to solve.
It was a genuinely wonderful experience reviewing the work that came in. Entries arrived from participants across Africa, Europe, and Asia, which made the review process exciting and competitive. For a mini-project challenge, the quality of ideas, effort, and execution across the board was impressive, and more than 90% of submissions scored above 55% against our judging criteria.
Before we get to the winners, a huge thank you to everyone who submitted a project, showed up to a session, or cheered on a teammate. This event only worked because of you.
And the winners are…
🏆 Winner: OSM Overpass Query Generator by Team FLAMES265
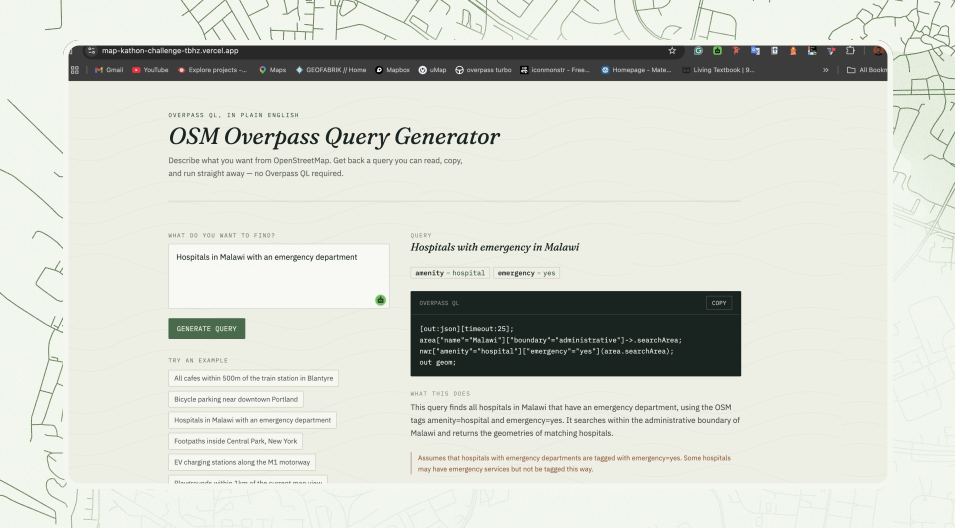
The OSM Overpass Query Generator is a lightweight web application that bridges the gap between human language and OpenStreetMap’s complex Overpass QL syntax. Designed for humanitarian workers, field logisticians, and non-technical users, the tool allows anyone to describe what they need from OpenStreetMap ,in plain English and receive a fully-formed Overpass query ready to copy and run in Overpass Turbo.
Built for the MapKathon Challenge with disaster response in mind, the app empowers users like Malawi Red Cross field officers to instantly generate road network queries for flood-affected districts such as Chikwawa and Nsanje. No coding expertise, no GIS specialist required. The tool handles the underlying tags, filters, and syntax through AI-powered interpretation, returning a query that users can review, validate, and execute on the live map in seconds.
By removing the technical barrier to accessing OpenStreetMap data, the generator transforms what was once a slow, expertise-dependent process into a rapid, self-service workflow helping response teams spend less time wrestling with code and more time delivering aid to the communities that need it most.
Project link: OSM Overpass Query Generator Chat
🥈 1st Runner-up: NetAScore4Teens: Mapping Streets Through the Lens of Children by Amna Azeem
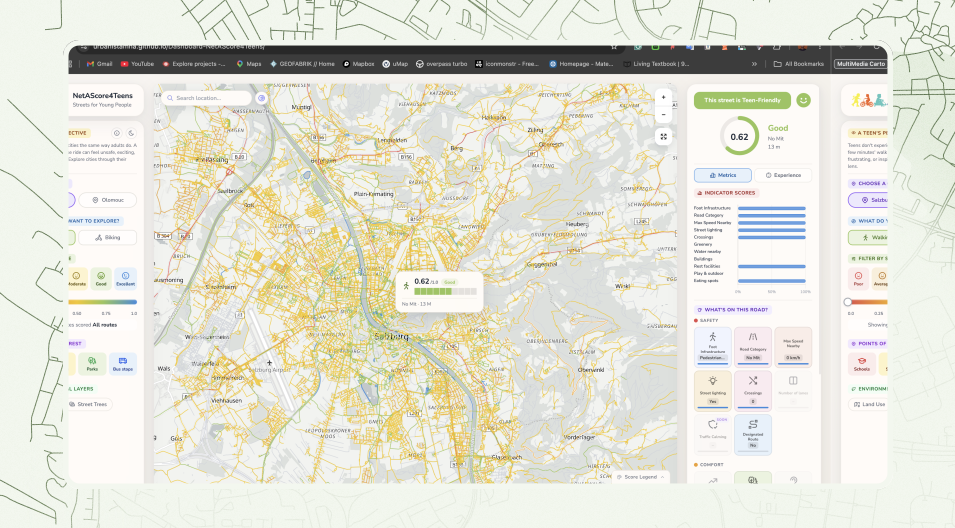
NetAScore4Teens is a child-centred mobility assessment framework and an accompanying interactive dashboard. The framework adapts NetAScore, an open-source, OpenStreetMap-based walkability and bikeability model, incorporating new indicators identified through participatory workshops with teenagers.
The model computes street-segment-level walkability and bikeability scores using OpenStreetMap tags such as sidewalk, highway, maxspeed, cycleway, lit, and amenity-based tags for play spaces, comfort facilities, and eating facilities, etc. Each segment’s score reflects how well that specific street supports children’s mobility, based purely on what is mapped in OpenStreetMap.
The interactive dashboard then translates these complex, multi-indicator scores into an accessible, explorable format, allowing planners, researchers, and decision-makers to identify which streets and neighbourhoods currently fall short of supporting children’s independent mobility.
Project link: NetAScore4Teens Dashboard
🥉 2nd Runner-up
-
Opadbisrescue by Paul Adebisi
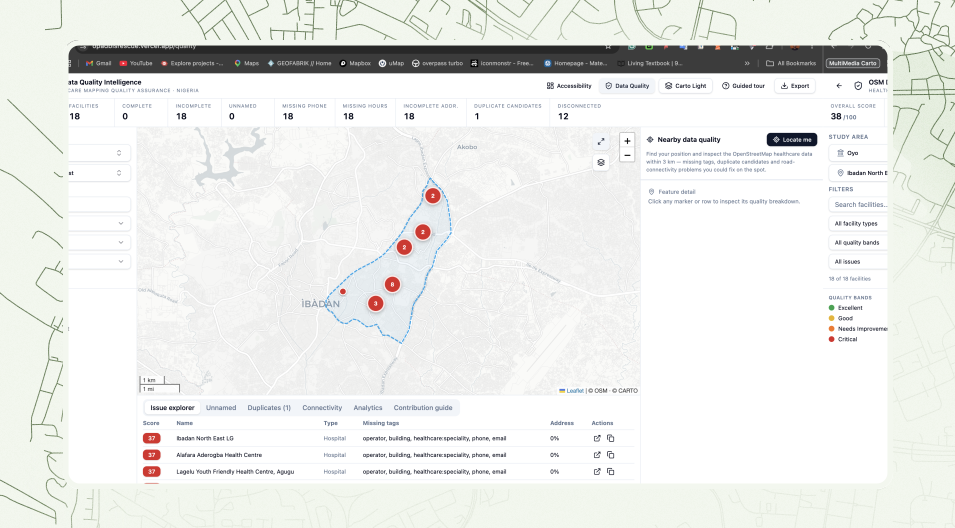
Opadbisrescue is a unified web application that couples a healthcare accessibility and emergency response workspace with a healthcare-specific data-quality auditor. It operates over live OpenStreetMap (OSM) data covering Nigeria’s 36 states and the Federal Capital Territory (FCT).
The platform enables health planners and emergency dispatchers to visualize healthcare facility distribution, identify coverage gaps at the Local Government Area (LGA) resolution, and route users to the nearest appropriate medical facility in under ten seconds. Simultaneously, the data-quality module audits the underlying map data. It scores each facility from 0–100 based on completeness, flags unconnected roads, detects duplicate records, and generates actionable, prioritized worklists for OSM contributors. By combining analysis and auditing on the identical dataset, the application solves a critical problem: it allows users to instantly determine whether a spatial coverage gap represents a genuine lack of healthcare services or simply missing map data.
Ultimately, the tool turns spatial analysis into an engine for continuous data improvement, providing reproducible evidence for government planners, NGOs, and the mapping community without requiring any procurement barriers or user accounts.
Project link: Opadbisrescue Dashboard
-
Who Can Reach a Clinic When It Floods? by Tamana Sisodiya
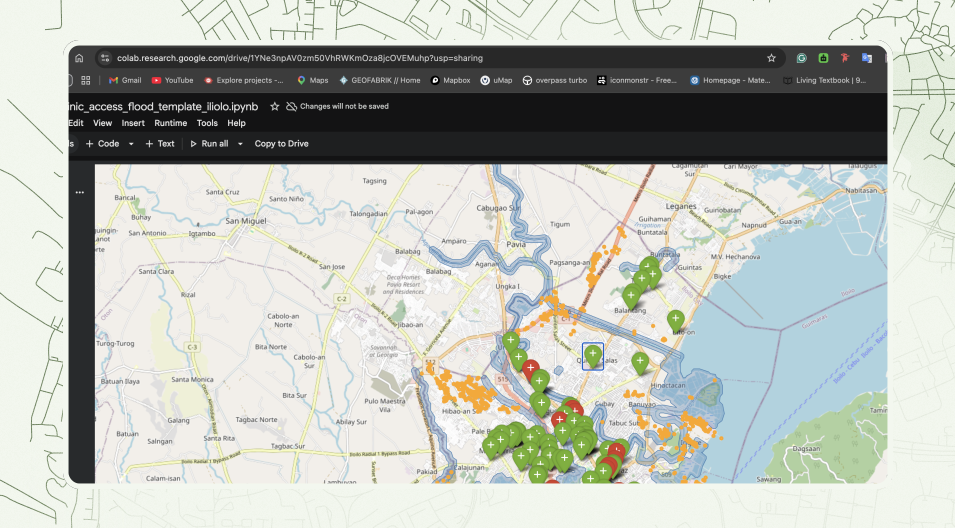
At its core, “Who can reach a clinic when it floods?” is a single, entirely reproducible Jupyter notebook. It takes raw OpenStreetMap data and translates it into three critical insights for any city you plug into it: the exact walking distances to healthcare using real street networks, a map of which facilities and neighbourhoods sit in flood-risk zones and a data-quality check using HeiGIT’s ohsome API to track how the city’s mapping history has evolved over time. If you want to analyse a completely different city, you just change a single configuration cell and hit run.
Project link: GitHub
Projects worth mentioning 📣
-
Mozambique Disaster Response Portal by Team OSM911, led by Joseph Munyenze
A bilingual web dashboard that answers one question as fast as possible during an emergency: where is the nearest help, and how long will it take to get there? Pick a location anywhere in Mozambique by dropping a pin or searching for a place, and the dashboard ranks the five closest health, shelter, rescue, water, and transport facilities. It draws a road route from your chosen location to any of them and exports the whole assessment as a bilingual PDF briefing.
Project link: OSM911 Dashboard
-
FloodLens by Christopher Somoye
FloodLens turns OpenStreetMap into a live flood-impact map. When a flood hits, the urgent question is “what got hit?” — which schools, clinics, and roads are underwater. Official facility-level damage figures take days of ground assessment to compile. FloodLens produces that estimate in minutes, because OpenStreetMap already knows what is on the ground before the flood ever happens. Satellites can show where the water is; only OSM’s pre-existing map tells you that a flooded pixel is a primary school or a health centre — and that it matters.
Project link: GitHub
-
Abuja Nav Buddy, by Team abuja-nav-buddy, led by Olamilekan Ibitoye
Abuja Nav Buddy is a web-based trip planning application built to help people navigate Abuja’s informal public transport system, including shared taxis, keke, and okadas. Unlike conventional navigation apps, which lack data for these services, our project began by solving the underlying problem: the data didn’t exist.
Project link: GitHub
-
Tracking Pressure on Rwanda’s Mountain Gorilla Habitat by Divine Izabera
This dashboard is an interactive geospatial summary of habitat conditions, human pressure, and conservation priorities around Volcanoes National Park, Rwanda, home to part of the world’s mountain gorilla population. It combines OpenStreetMap building footprints, protected-area boundaries, and administrative boundaries with satellite-derived environmental indicators to answer a practical question: where is human settlement pressure closest to the park, and where does suitable gorilla habitat remain?
Project link: ArcGIS Dashboard
-
Automating the Spatial Analysis of Healthcare Facility Distribution using OpenStreetMap Data: Design and Development of a QGIS Plugin (HealthOSM) by Ezekiel Ogungbemi
A QGIS plugin, HealthOSM, that automates the end-to-end extraction, processing, and visualisation of OpenStreetMap healthcare facility distribution within any user-defined administrative boundary with sub-administrative attributes.
Project link: Documentation
Thank you to our sponsors and partners 👏
None of this would have been possible without the support of our sponsors and partners. A big thank you to the OSM Engineering Working Group and Unpatterned for backing this event and helping the community build tools that matter.
We’d also like to give a special shoutout to the UseOSM team for making this Map<>kathon happen.
To everyone who submitted a project, showed up, or supported the community during Map<>kathon 2026, thank you. We can’t wait to see what you build next.
Get in touch
Have a question about the Map<>kathon, or just want to say hi? We’d love to hear from you.
Email: connect@unpatterned.org